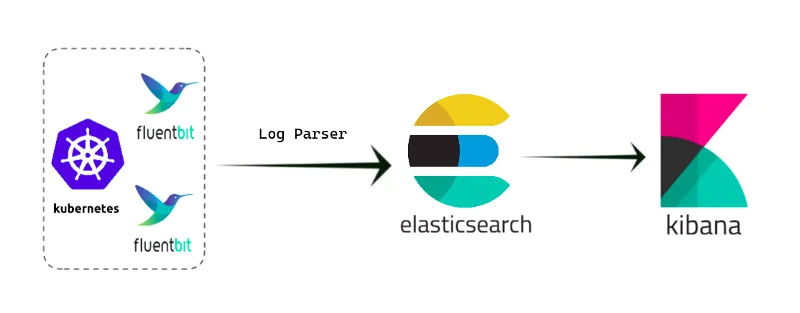
Hello everyone, today I will explain how to set up the Elasticsearch, Fluentd, and Kibana Stack for logging our applications in a Kubernetes cluster.
I won’t go into detail on how to set up a Kubernetes cluster since there are many tutorials available online.
For logging our applications, we will be using Elasticsearch, Fluentd, and Kibana. These are popular tools used for processing, storing, and visualizing data.
- Elasticsearch — is a distributed search and analytics system based on Apache Lucene. It provides powerful capabilities for full-text search and real-time analysis of structured data. It is used for storing and indexing large volumes of data, enabling fast access to it.
- FluentD — is a log and event collection and aggregation tool. It provides a unified interface for collecting data from various sources and sending it to different target storages, including Elasticsearch. Fluentd can work with different protocols and data formats, offering a flexible and scalable platform for log collection and forwarding.
- Kibana — is a web interface for visualizing and analyzing data stored in Elasticsearch. It allows you to create interactive dashboards, charts, and reports based on the data collected and indexed in Elasticsearch. It provides tools for data exploration, trend visualization, searching, and anomaly detection.
- To start, I suggest launching a test Nginx Deployment that will store logs in
/var/logs/nginx/.
apiVersion: apps/v1
kind: Deployment
metadata:
  namespace: default
  name: nginx-deployment
spec:
  replicas: 1
  selector:
    matchLabels:
      app: nginx
  template:
    metadata:
      labels:
        app: nginx
    spec:
      containers:
      - name: nginx
        image: nginx
        ports:
        - containerPort: 80
        volumeMounts:
        - name: nginx-logs
          mountPath: /var/log/nginx
      volumes:
      - name: nginx-logs
        persistentVolumeClaim:
          claimName: nginx-logs-pvc
---


apiVersion: v1
kind: Service
metadata:
  namespace: default
  name: nginx-service
spec:
  type: NodePort
  selector:
    app: nginx
  ports:
    - protocol: TCP
      port: 80
      targetPort: 80

---
apiVersion: v1
kind: PersistentVolumeClaim
metadata:
  namespace: default
  name: nginx-logs-pvc
spec:
  accessModes:
  storageClassName: local-storage
    - ReadWriteOnce
  resources:
    requests:
      storage: 1Gi

---
apiVersion: v1
kind: PersistentVolume
metadata:
  name: nginx-logs
  namespace: default
spec:
  capacity:
    storage: 1Gi
  volumeMode: Filesystem
  accessModes:
  - ReadWriteOnce
  persistentVolumeReclaimPolicy: Retain
  storageClassName: local-storage
  local:
    path: /var/log/nginx
  nodeAffinity:
    required:
      nodeSelectorTerms:
      - matchExpressions:
        - key: kubernetes.io/hostname
          operator: In
          values:
          - worker-2
If you’re using Persistent Volumes (PV) and Persistent Volume Claims (PVC) to store logs outside of pods, it means that the logs will be stored on a separate volume that is resilient to pod restarts and deletions. This ensures that your logs won’t be lost when a pod is restarted or deleted.
However, if you don’t have specific requirements for preserving logs after pod restarts or deletions, and you don’t plan to scale your storage, you can simply save the logs inside the pod without using PV and PVC.
2. Next, let’s prepare the PV and StorageClass for Elasticsearch
apiVersion: v1
kind: PersistentVolume
metadata:
  name: elk-pv-0
  namespace: logging
spec:
  capacity:
    storage: 20Gi
  volumeMode: Filesystem
  accessModes:
  - ReadWriteOnce
  persistentVolumeReclaimPolicy: Retain
  storageClassName: local-storage
  local:
    path: /home/akylson/data/elasticsearch/
  nodeAffinity:
    required:
      nodeSelectorTerms:
      - matchExpressions:
        - key: kubernetes.io/hostname
          operator: In
          values:
          - control-plane

---
apiVersion: storage.k8s.io/v1
kind: StorageClass
metadata:
  name: local-storage
  namespace: kube-logging
provisioner: kubernetes.io/no-provisioner
volumeBindingMode: WaitForFirstConsumer

---
apiVersion: v1
kind: PersistentVolume
metadata:
  name: elk-pv-1
  namespace: logging
spec:
  capacity:
    storage: 20Gi
  volumeMode: Filesystem
  accessModes:
  - ReadWriteOnce
  persistentVolumeReclaimPolicy: Retain
  storageClassName: local-storage
  local:
    path: /home/akylson/data/elasticsearch/
  nodeAffinity:
    required:
      nodeSelectorTerms:
      - matchExpressions:
        - key: kubernetes.io/hostname
          operator: In
          values:
          - worker-1


---
apiVersion: v1
kind: PersistentVolume
metadata:
  name: elk-pv-2
  namespace: logging
spec:
  capacity:
    storage: 20Gi
  volumeMode: Filesystem
  accessModes:
  - ReadWriteOnce
  persistentVolumeReclaimPolicy: Retain
  storageClassName: local-storage
  local:
    path: /home/akylson/data/elasticsearch/
  nodeAffinity:
    required:
      nodeSelectorTerms:
      - matchExpressions:
        - key: kubernetes.io/hostname
          operator: In
          values:
          - worker-2
$kubectl create -f pv.yamlNow we can proceed with the installation of Elasticsearch. We will use Helm.
#addint elastic repo
$helm repo add elastic https://helm.elastic.co

#updating helm repo
$helm repo update

#Installing elasticsearch
$helm install elasticsearch  elastic/elasticsearch -f values.yaml
Here is my values.yaml file:
esJavaOpts: "-Xmx128m -Xms128m"

# resources:
#   requests:
#     cpu: "400m"
#     memory: "3Gi"
#   limits:
#     cpu: "4000m"
#     memory: "5Gi"

volumeClaimTemplate:
  accessModes: [ "ReadWriteOnce" ]
  storageClassName: "local-storage"
  resources:
    requests:
      storage: 20Gi


extraInitContainers:
  - name: init-volume-permission
    image: busybox
    command: ['chown', '-R', '1000:1000', '/usr/share/elasticsearch/']
    volumeMounts:
    - mountPath: /usr/share/elasticsearch/data
      name: elasticsearch-master
    securityContext:
      privileged: true
      runAsUser: 0

readinessProbe:
  failureThreshold: 3
  initialDelaySeconds: 200
  periodSeconds: 10
  successThreshold: 3
  timeoutSeconds: 5

# https://www.elastic.co/guide/en/elasticsearch/reference/current/cluster-health.html#request-params wait_for_status
clusterHealthCheckParams: 'wait_for_status=yellow&timeout=20s'
$kubectl get pods
NAME READY STATUS RESTARTS AGE
elasticsearch-master-0 1/1 Running 1 (5d8h ago) 5d15h
elasticsearch-master-1 1/1 Running 1 (5d8h ago) 5d15h
elasticsearch-master-2 1/1 Running 1 (5d14h ago) 5d15hPlease make sure you save your Elasticsearch password, because we will need it later.
3. Let’s proceed with the installation of Kibana. We will also use Helm.
$helm install kibana elastic/kibana Make sure you save your Kibana password.
4. To install FluentD using Helm, follow these steps:
$helm repo add bitnami https://charts.bitnami.com/bitnami
$helm repo update
$helm install fluentd bitnami/fluentd
Next, let’s wait for all the pods to be up and running. Once all the pods are running, we must update the “fluentd-forwarder-cm” config map to forward logs to Elasticsearch.
apiVersion: v1
kind: ConfigMap
metadata:
  name: fluentd-forwarder-cm
  labels:
    app.kubernetes.io/component: forwarder
    app.kubernetes.io/instance: fluentd
    app.kubernetes.io/managed-by: Helm
    app.kubernetes.io/name: fluentd
    helm.sh/chart: fluentd-5.8.2
  annotations:
    meta.helm.sh/release-name: fluentd
data:
  fluentd-inputs.conf: |

    <source>
      @type http
      port 9880
    </source>
    # Where our logs are stored
    <source>
      @type tail
      path /var/log/nginx/access.log
      pos_file /var/log/nginx/access.log.pos
      tag nginx.access
      <parse>
        @type none
      </parse>
    </source>


    # enrich with kubernetes metadata
    <filter kubernetes.**>
      @type kubernetes_metadata
    </filter>
  fluentd-output.conf: |
    # Throw the healthcheck to the standard output instead of forwarding it
    <match fluentd.healthcheck>
      @type null
    </match>
    # Forwarding our logs to  elasticsearch
    <match nginx.access>
      @type elasticsearch
      host "elasticsearch-master.default.svc.cluster.local"
      port "9200"
      index_name "nginx-logs"
      scheme https
      ssl_verify false
      user elastic
      password MyElasticSearchPassword # Your Elasticsearch password
      <buffer>
        @type file
        path /var/log/fluentd/buffers/nginx-logs.buffer
        flush_thread_count 2
        flush_interval 5s
      </buffer>
    </match>
  fluentd.conf: |
    # Ignore fluentd own events
    <match fluent.**>
      @type null
    </match>
    @include metrics.conf
    @include fluentd-inputs.conf
    @include fluentd-output.conf
  metrics.conf: |
    # Prometheus Exporter Plugin
    # input plugin that exports metrics
    <source>
      @type prometheus
      port 24231
    </source>
    # input plugin that collects metrics from MonitorAgent
    <source>
      @type prometheus_monitor
      <labels>
        host ${hostname}
      </labels>
    </source>
    # input plugin that collects metrics for output plugin
    <source>
      @type prometheus_output_monitor
      <labels>
        host ${hostname}
      </labels>
    </source>
    # input plugin that collects metrics for in_tail plugin
    <source>
      @type prometheus_tail_monitor
      <labels>
        host ${hostname}
      </labels>
    </source>
binaryData: {}
After you have made changes to the configmap, we need to restart it. To do this, you can use the following command.
$kubectl rollout daemonset/fluentdWait until the Fluentd pods restart.
After that, you will need to change the Kibana service from ClusterIP to NodePort. Let’s do this using the following command.
$kubectl patch svc kibana-kibana -p '{"spec": {"type": "NodePort"}}'
$kubectl get svc

# Check the NodePort assigned to your Kibana service.
Next, go to http://ip-address:nodeport.
Navigate to Stack Management → Index Management in the menu.
You should see a new index called “nginx-logs”.
If it’s present, then you’ve done everything correctly.
Next, you can add this index to Kibana.
Go to Data View -> Create Data View and add our index.
Name: nginx logs
Index Patterns: nginx*
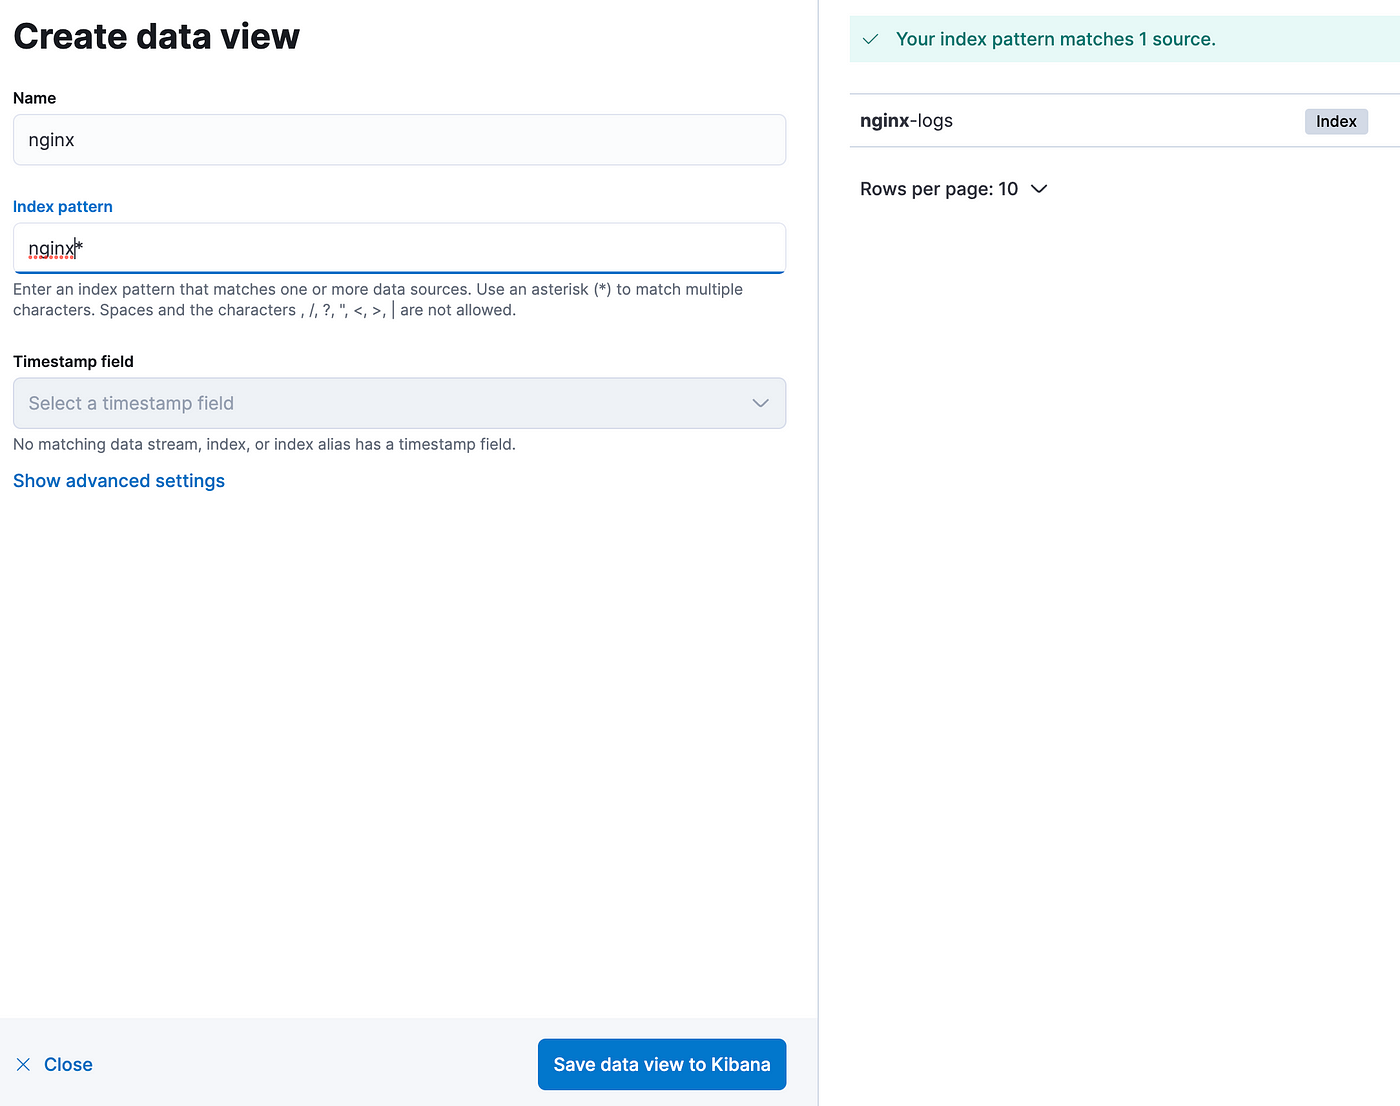
After this, you will start receiving your logs in Kibana.
If you find value in my article and want to show your appreciation, consider buying me a coffee. Your support would mean a lot to me!