What is Kubernetes Dashboard
The Kubernetes Dashboard is a web-based UI that allows administrators to perform basic operating tasks and review cluster events. You can use the dashboard as a quick tool for viewing and monitoring the cluster, submitting manifests, inspecting logs, and getting system information.
Let’s start
curl -O https://raw.githubusercontent.com/kubernetes/dashboard/master/aio/deploy/recommended.yamlNow open recommended.yaml file
and make changes as it image below:

Installing
$kubectl create -f recommended.yaml
$kubectl get pods -A -o wide
$kubectl get service -n kubernetes-dashboard -o wide
Make sure all pods are running
Configuring Kubernetes-Dashboard
Let’s create Service Account for Kubernetes Dashboard
kubectl apply -f - <<EOF
apiVersion: v1
kind: Secret
metadata:
  name: admin-user
  namespace: kubernetes-dashboard
  annotations:
    kubernetes.io/service-account.name: admin-user
type: kubernetes.io/service-account-token
EOF
Now we need ClusterRoleBinding
$ cat >>dashboard-admin-bind-cluster-role.yaml<<EOF
apiVersion: rbac.authorization.k8s.io/v1
kind: ClusterRoleBinding
metadata:
  name: admin-user
roleRef:
  apiGroup: rbac.authorization.k8s.io
  kind: ClusterRole
  name: cluster-admin
subjects:
- kind: ServiceAccount
  name: admin-user
  namespace: kubernetes-dashboard
EOF
Create this :
$ kubectl create -f dashboard-admin-bind-cluster-role.yamlInstalling Metrics on Kubernetes cluster
Download metrics manifest
$wget https://github.com/kubernetes-sigs/metrics-server/releases/latest/download/components.yamlNext we need to edit this file. Find args in Deployment section
spec:
  containers:
  - args:
    - --cert-dir=/tmp
    - --secure-port=443
    - --kubelet-preferred-address-types=InternalIP,ExternalIP,Hostname
    - --kubelet-use-node-status-port
    - --metric-resolution=15s
And add these two lines
- --kubelet-insecure-tls=true
- --kubelet-preferred-address-types=InternalIP
Now we can install our metrics — components.yaml
kubectl apply -f components.yaml
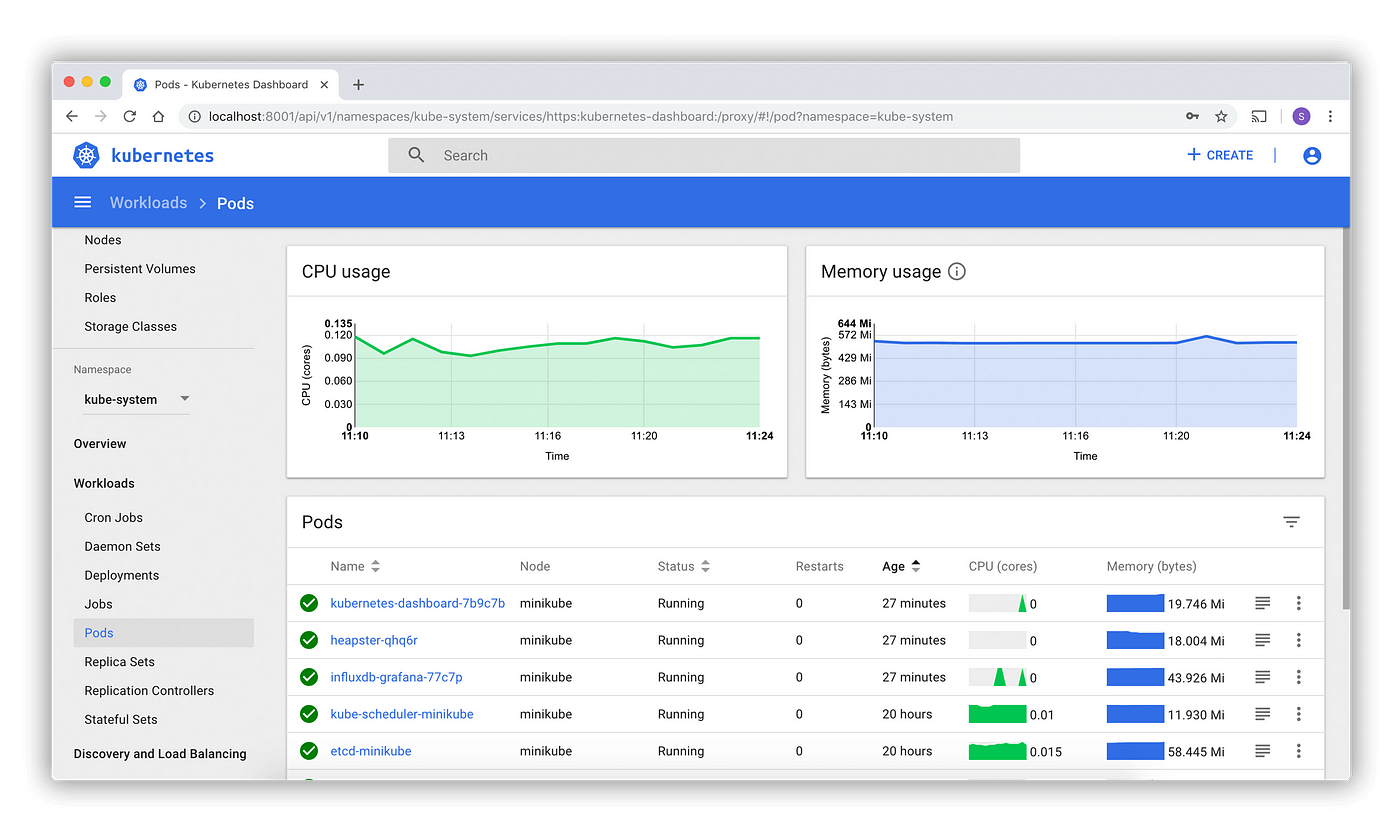
After all pods are running we can open our Kubernetes Dashboard in Browser : https://NodeIP:30001
We need a Token for accessing the Kubernetes Dashboard
$kubectl -n kubernetes-dashboard create token admin-userYou should see something like this:
eyiRhbGci1iJSgZ111NiIsImtpZCI6InVWZV9UaTY2c05rM1E0czU5ZnpJTkJEZW00c0xCR0NHRjg4R0RvWFhMU2cifQ.eyJpc3MiOiJrdWJlcm5ldGVzL3NlcnZpY2VhY2NvdW50Iiwia3ViZXJuZXRlcy5pby9zZXJ2aWNlYWNjb3VudC9uYW1lc3BhY2UiOiJrdWJlcm5ldGVzLWRhc2hib2FyZCIsImt1YmVybmV0ZXMuaW8vc2VydmljZWFjY291bnQvc2VjcmV0Lm5hbWUiOiJhZG1pbi11c2VyIiwia3ViZXJuZXRlcy5pby9zZXJ2aWNlYWNjb3VudC9zZXJ2aWNlLWFjY291bnQubmFtZSI6ImFkbWluLXVzZXIiLCJrdWJlcm5ldGVzLmlvL3NlcnZpY2VhY2NvdW50L3NlcnZpY2UtYWNjb3VudC51aWQiOiI5OTZjZjkzNy0yNWZjLTQxM2YtYjdhNS0yZGJjNTIzOWE2NjciLCJzdWIiOiJzeXN0ZW06c2VydmljZWFjY291bnQ6a3ViZXJuZXRlcy1kYXNoYm9hcmQ6YWRtaW4tdXNlciJ9.TX5NYR1NKUVgis0OrC7Wq1pFup9IVHHAnN3Gstmajo5gD1A6oPnpts9UXPpnHMwTIa86EdOBZbn1wgu-2jYdqV-IRMkcIfJ_ZZ3v_xFW_DIfNe1kuCRIaegUdiguYFFaKd9xqdaCiuXtYjq3rkdPOZJmou9yrtooduP5NejMquuhWFcvDkHWJTXh1hR-Fw664Vwz0hvoh-gvkxDnd3vJo1ZFRlaXg5aayWIsDoz51nYWoa_uKIz5LU9RCIdu8bhvPxEearnLDlGXxQ7VU1xMS7HU88T5B7Ceda0nSD8OMLpYlwT1UNZAum0ooa8k5X55H-KVjOl2maHwzn5P044hhQCopy it and paste to “Enter Token” field
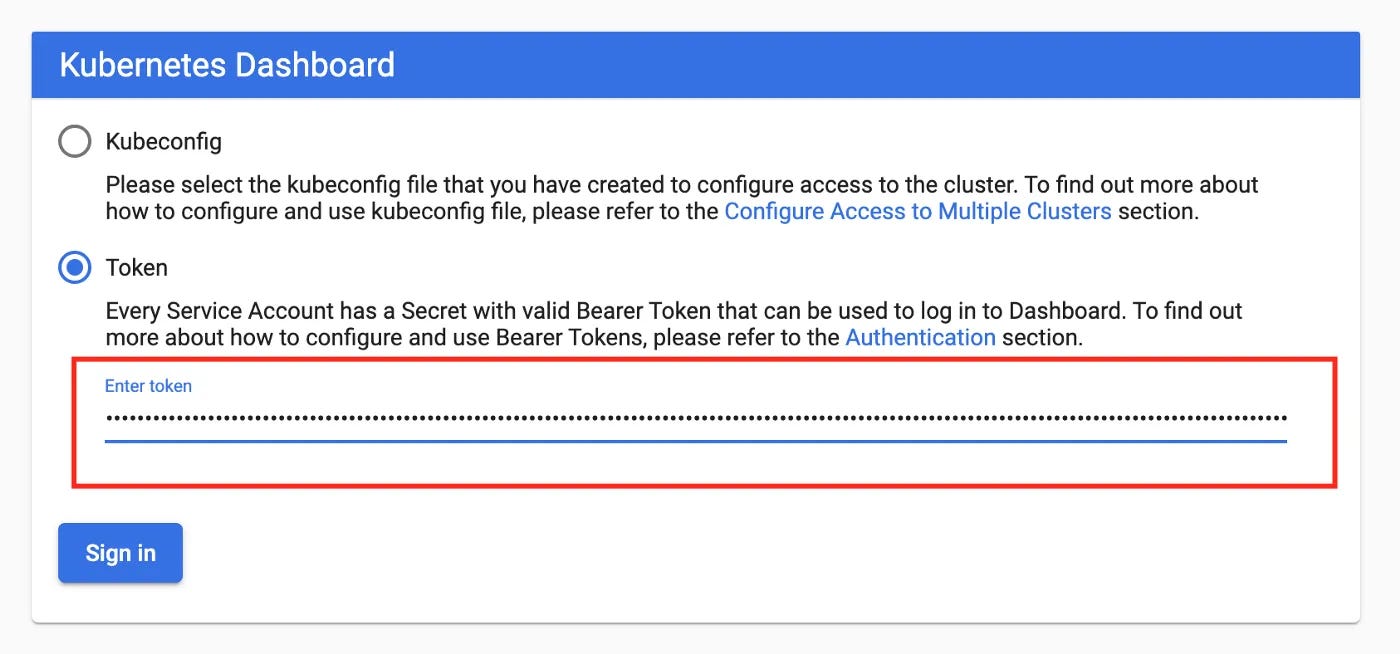
Congratulations! Now we have access to our Kubernetes Dashboard!
Additional information:
If your metrics doesn’t work:
https://stackoverflow.com/questions/68648198/metrics-service-in-kubernetes-not-working